Cloud Monitoring: Qwik Start
GSP089

Overview
Cloud Monitoring provides visibility into the performance, uptime, and overall health of cloud-powered applications. Cloud Monitoring collects metrics, events, and metadata from Google Cloud, Amazon Web Services, hosted uptime probes, application instrumentation, and a variety of common application components including Cassandra, Nginx, Apache Web Server, Elasticsearch, and many others. Cloud Monitoring ingests that data and generates insights via dashboards, charts, and alerts. Cloud Monitoring alerting helps you collaborate by integrating with Slack, PagerDuty, HipChat, Campfire, and more.
This hands-on lab shows you how to monitor a Compute Engine virtual machine (VM) instance with Cloud Monitoring. You'll also install monitoring and logging agents for your VM which collects more information from your instance, which could include metrics and logs from 3rd party apps.
Setup and requirements
Before you click the Start Lab button
Read these instructions. Labs are timed and you cannot pause them. The timer, which starts when you click Start Lab, shows how long Google Cloud resources will be made available to you.
This hands-on lab lets you do the lab activities yourself in a real cloud environment, not in a simulation or demo environment. It does so by giving you new, temporary credentials that you use to sign in and access Google Cloud for the duration of the lab.
What you need
To complete this lab, you need:
- Access to a standard internet browser (Chrome browser recommended).
- Time to complete the lab.
Note: If you already have your own personal Google Cloud account or project, do not use it for this lab.
Note: If you are using a Chrome OS device, open an Incognito window to run this lab.
How to start your lab and sign in to the Google Cloud Console
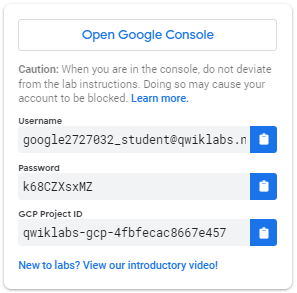
Click the Start Lab button. If you need to pay for the lab, a pop-up opens for you to select your payment method. On the left is a panel populated with the temporary credentials that you must use for this lab.
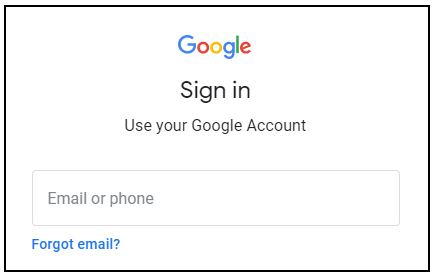
Copy the username, and then click Open Google Console. The lab spins up resources, and then opens another tab that shows the Sign in page.
Tip: Open the tabs in separate windows, side-by-side.
In the Sign in page, paste the username that you copied from the left panel. Then copy and paste the password.
Important: You must use the credentials from the left panel. Do not use your Google Cloud Training credentials. If you have your own Google Cloud account, do not use it for this lab (avoids incurring charges).
Click through the subsequent pages:
- Accept the terms and conditions.
- Do not add recovery options or two-factor authentication (because this is a temporary account).
- Do not sign up for free trials.
After a few moments, the Cloud Console opens in this tab.
Create a Compute Engine instance
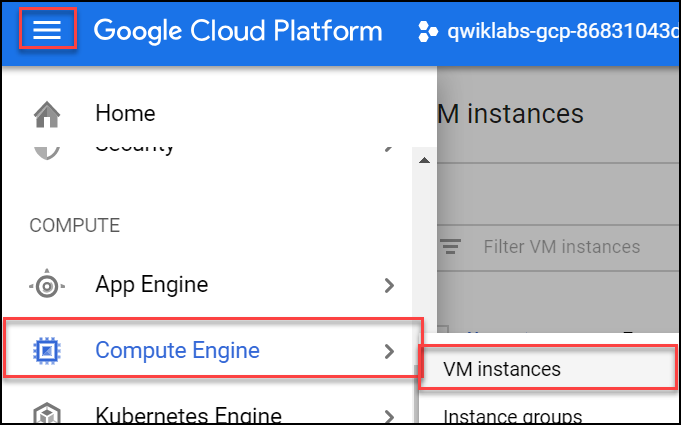
- In the Cloud Console dashboard, go to Navigation menu > Compute Engine > VM instances, then click Create instance.
Fill in the fields as follows, leaving all other fields at the default value:
Field Value Name lamp-1-vm Region us-central1 (Iowa) Zone us-central1-a Series N1 Machine type n1-standard-2 Firewall check Allow HTTP traffic Click Create.
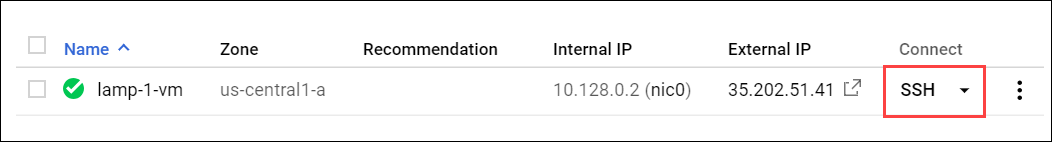
Wait a couple of minutes, you'll see a green check when the instance has launched.
Click Check my progress below. A green check confirms you're on track.
Add Apache2 HTTP Server to your instance
- In the Cloud Console, click SSH to open a terminal to your instance.
Run the following commands in the SSH window to set up Apache2 HTTP Server:
When asked if you want to continue, enter Y.
Click Check my progress below. A green check confirms you're on track.
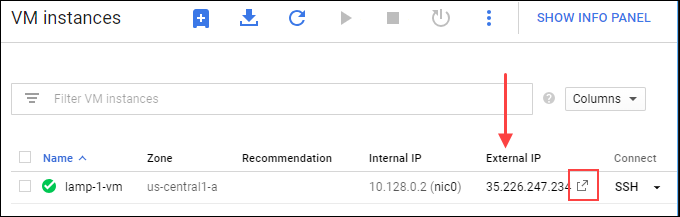
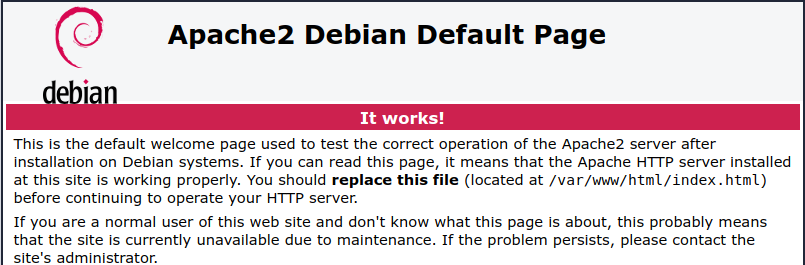
- Return to the Cloud Console, on the VM instances page. Click the
External IPforlamp-1-vminstance to see the Apache2 default page for this instance.
Click Check my progress below. A green check confirms you're on track.
Create a Monitoring Metrics Scope
Now set up a Monitoring Metrics Scope that's tied to your Google Cloud Project. The following steps create a new account that has a free trial of Monitoring.
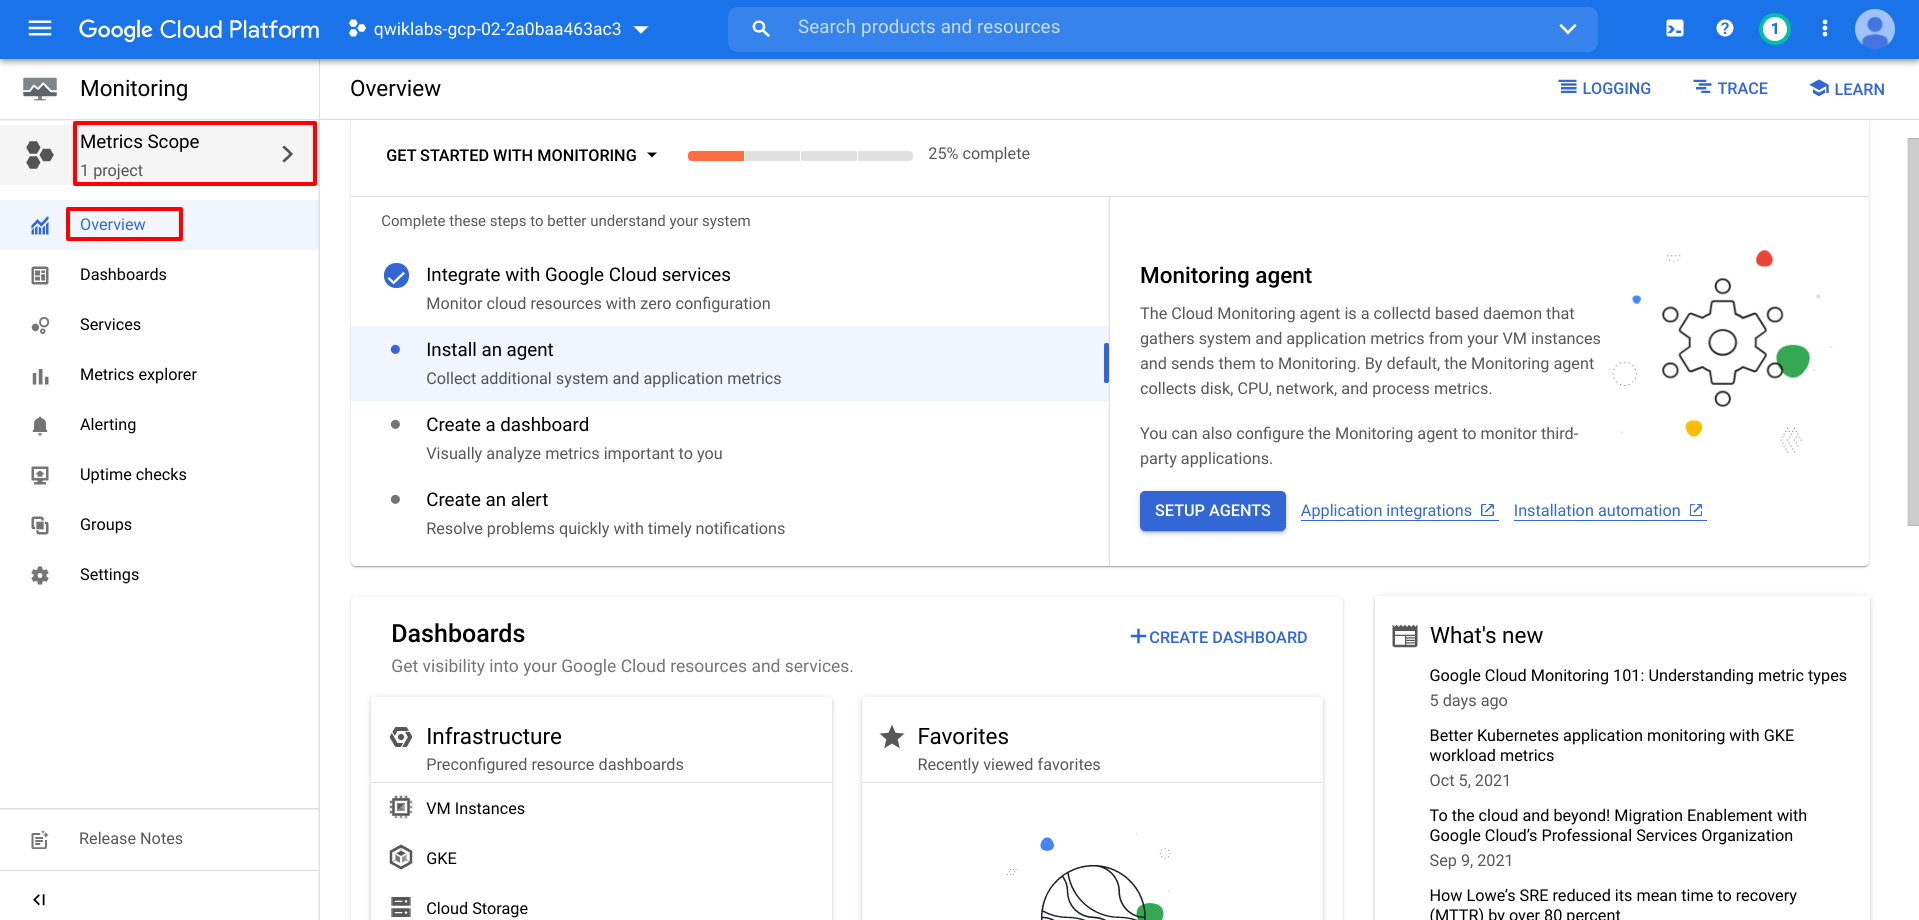
In the Cloud Console, click Navigation menu > Monitoring.
When the Monitoring Overview page opens, your metrics scope project is ready.
Install the Monitoring and Logging agents
Agents collect data and then send or stream info to Cloud Monitoring in the Cloud Console.
The Cloud Monitoring agent is a collectd-based daemon that gathers system and application metrics from virtual machine instances and sends them to Monitoring. By default, the Monitoring agent collects disk, CPU, network, and process metrics. Configuring the Monitoring agent allows third-party applications to get the full list of agent metrics. See Cloud Monitoring agent overview for more information.
In this section, you install the Cloud Logging agent to stream logs from your VM instances to Cloud Logging. Later in this lab, you see what logs are generated when you stop and start your VM.
Install agents on the VM:
Run the Monitoring agent install script command in the SSH terminal of your VM instance to install the Cloud Monitoring agent.
When asked if you want to continue, enter Y.
Run the Logging agent install script command in the SSH terminal of your VM instance to install the Cloud Logging agent
Create an uptime check
Uptime checks verify that a resource is always accessible. For practice, create an uptime check to verify your VM is up.
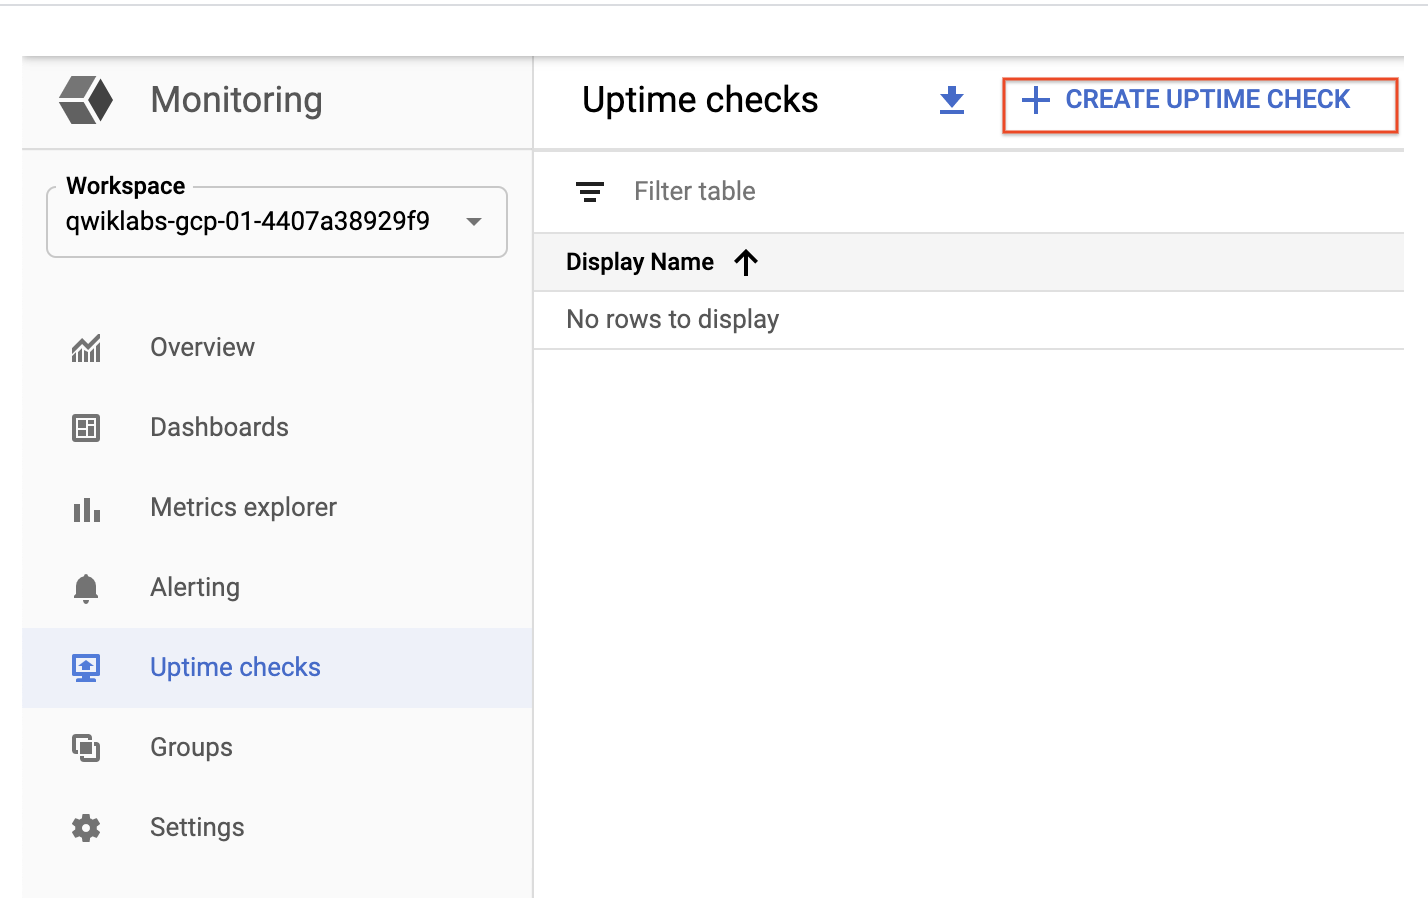
- In the Cloud Console, in the left menu, click Uptime checks, and then click Create Uptime Check.
- Set the following fields:
Title: Lamp Uptime Check, then click Next.
Protocol: HTTP
Resource Type: Instance
Applies to: Single, lamp-1-vm
Path: leave at default
Check Frequency: 1 min
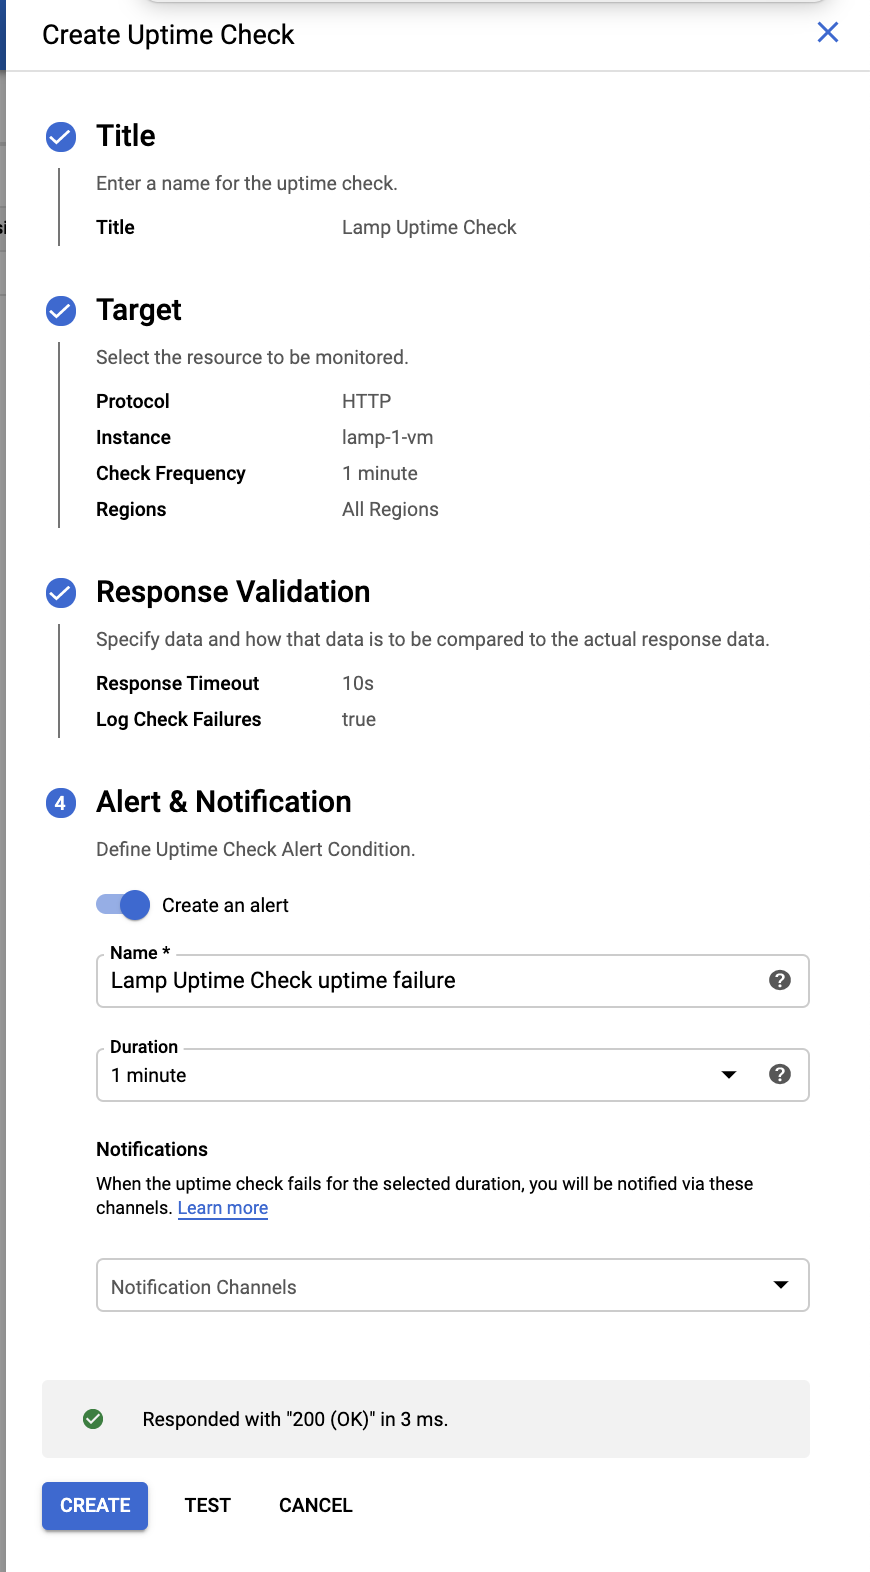
Click on Next to leave the other details to default and click Test to verify that your uptime check can connect to the resource.
When you see a green check mark everything can connect. Click Create.
The uptime check you configured takes a while for it to become active. Continue with the lab, you'll check for results later. While you wait, create an alerting policy for a different resource.
Create an alerting policy
Use Cloud Monitoring to create one or more alerting policies.
In the left menu, click Alerting, and then click Create Policy.
Click Add Condition.
Set the following in the panel that opens, leave all other fields at the default value.
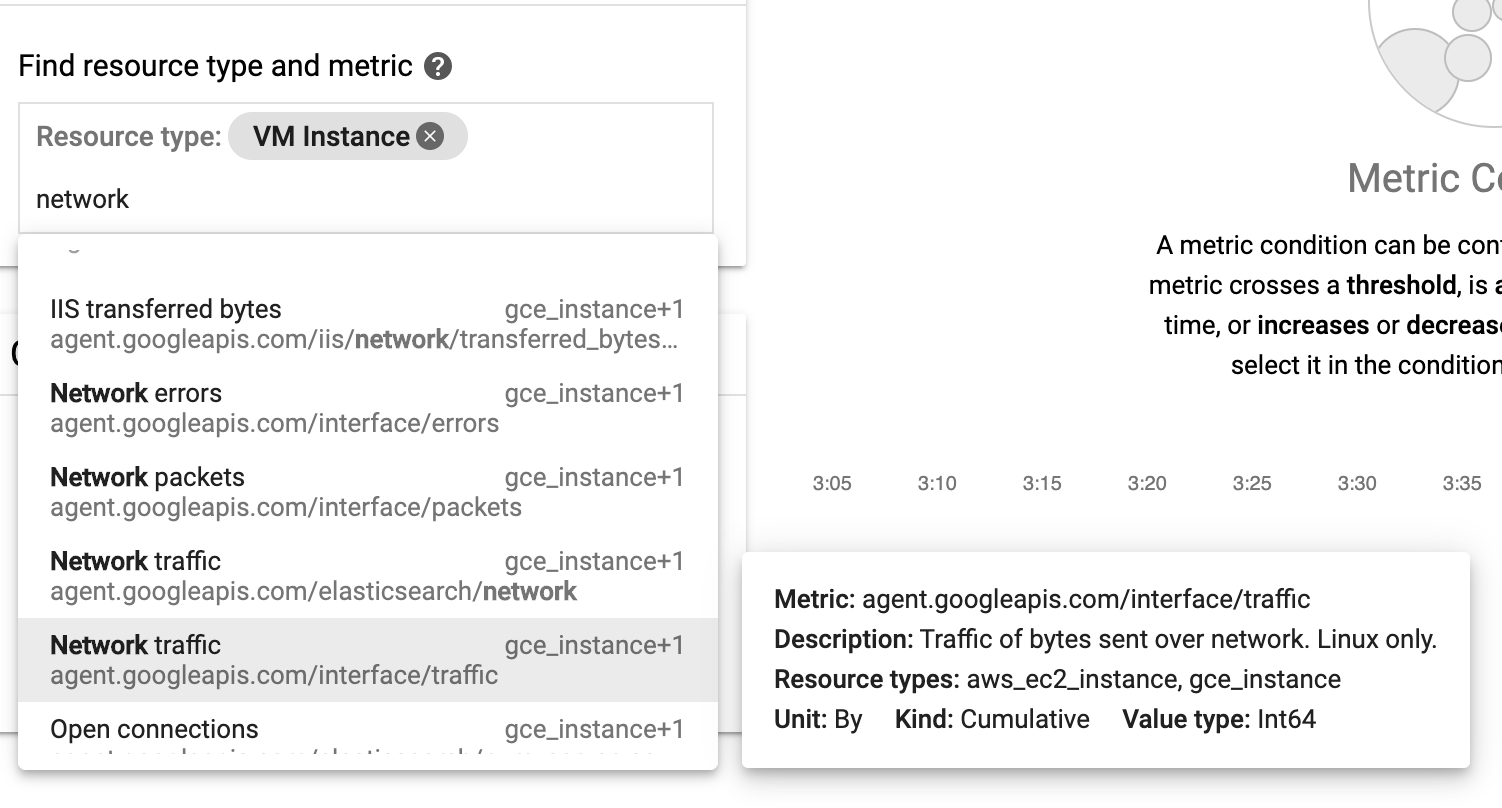
Target: Start typing "VM" in the resource type and metric field, and then select:
Resource Type: VM Instance (gce_instance)
Metric: Type "network", and then select Network traffic (gce_instance+1). Be sure to choose the Network traffic resource with
agent.googleapis.com/interface/traffic:
Configuration
- Condition: is above
- Threshold: 500
- For: 1 minute
Click ADD.
Click on Next.
Click on drop down arrow next to Notification Channels, then click on Manage Notification Channels.
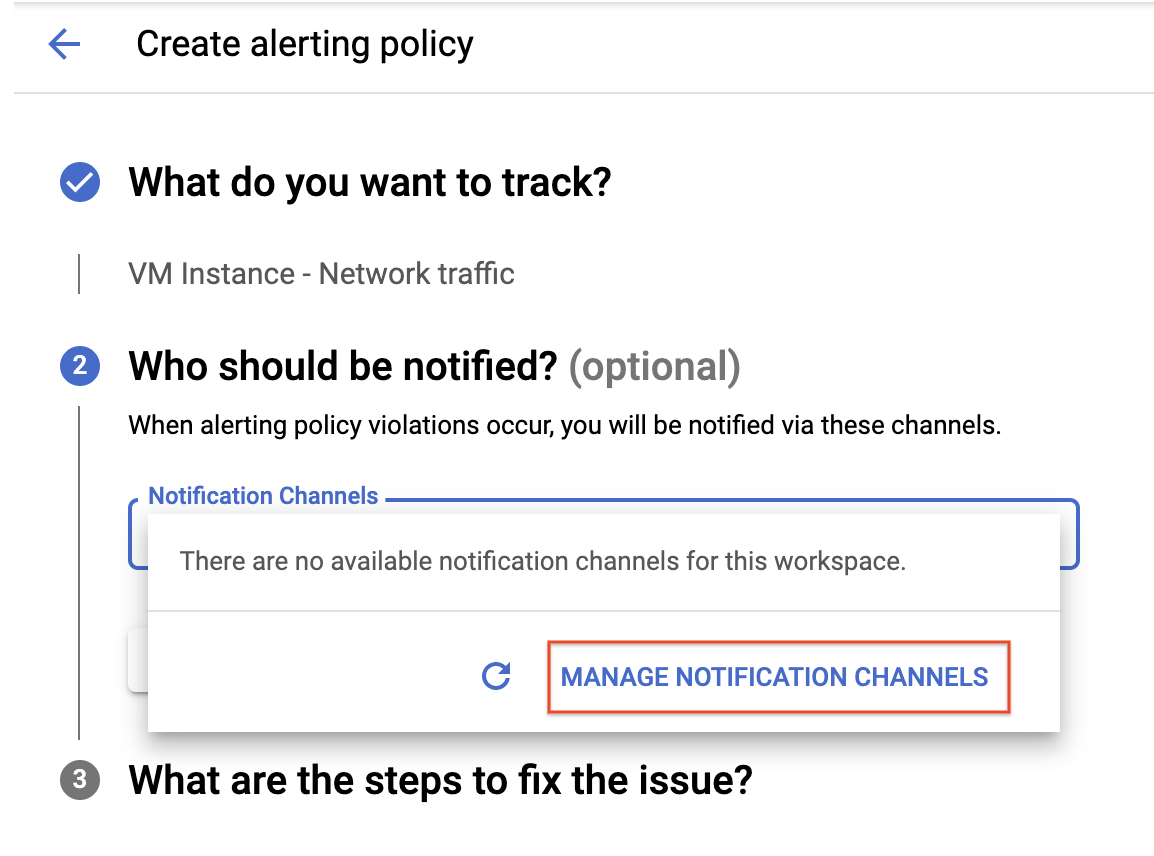
A Notification channels page will open in new tab.
- Scroll down the page and click on ADD NEW for Email.

In Create Email Channel dialog box, enter your personal email address in the Email Address field and a Display name.
Click on Save.
Go back to the previous Create alerting policy tab.
Click on Notification Channels again, then click on the Refresh icon to get the display name you mentioned in the previous step.
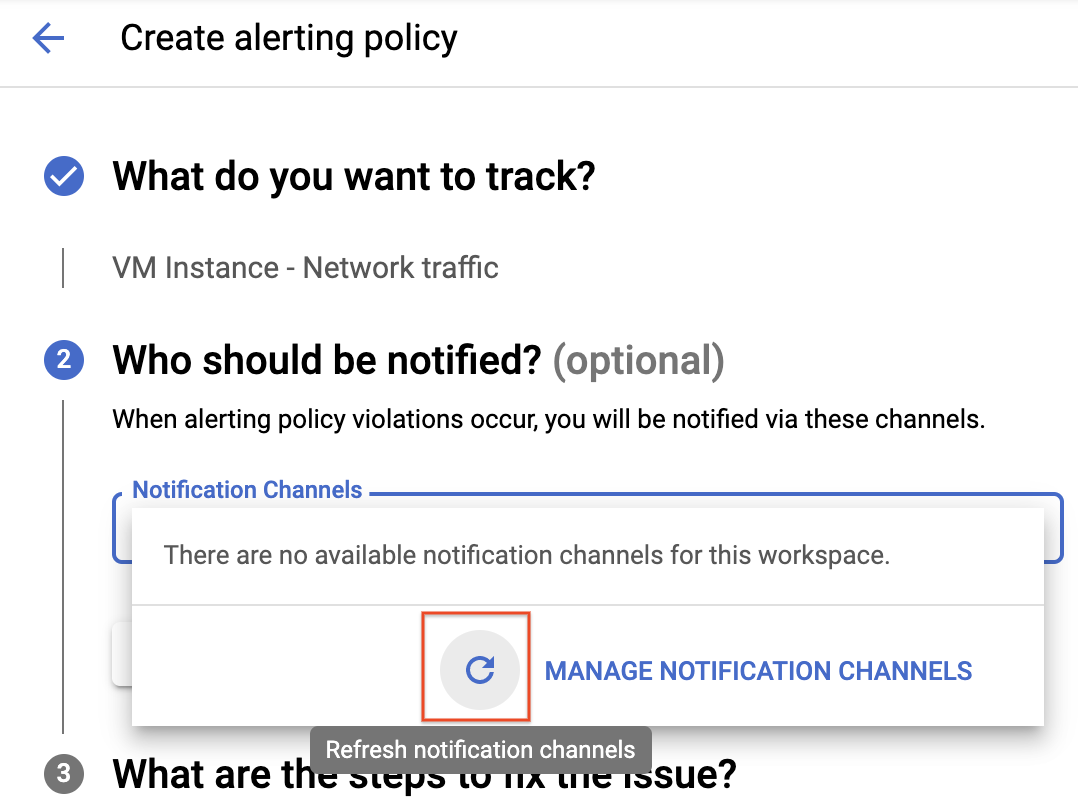
Now, select your Display name and click OK.
Click Next.
Mention the Alert name as
Inbound Traffic Alert.Add a message in documentation, which will be included in the emailed alert.
Click on Save.
You've created an alert! While you wait for the system to trigger an alert, create a dashboard and chart, and then check out Cloud Logging.
Click Check my progress below. A green check confirms you're on track.
Create a dashboard and chart
You can display the metrics collected by Cloud Monitoring in your own charts and dashboards. In this section you create the charts for the lab metrics and a custom dashboard.
In the left menu select Dashboards, and then Create Dashboard.
Name the dashboard
Cloud Monitoring LAMP Qwik Start Dashboard.
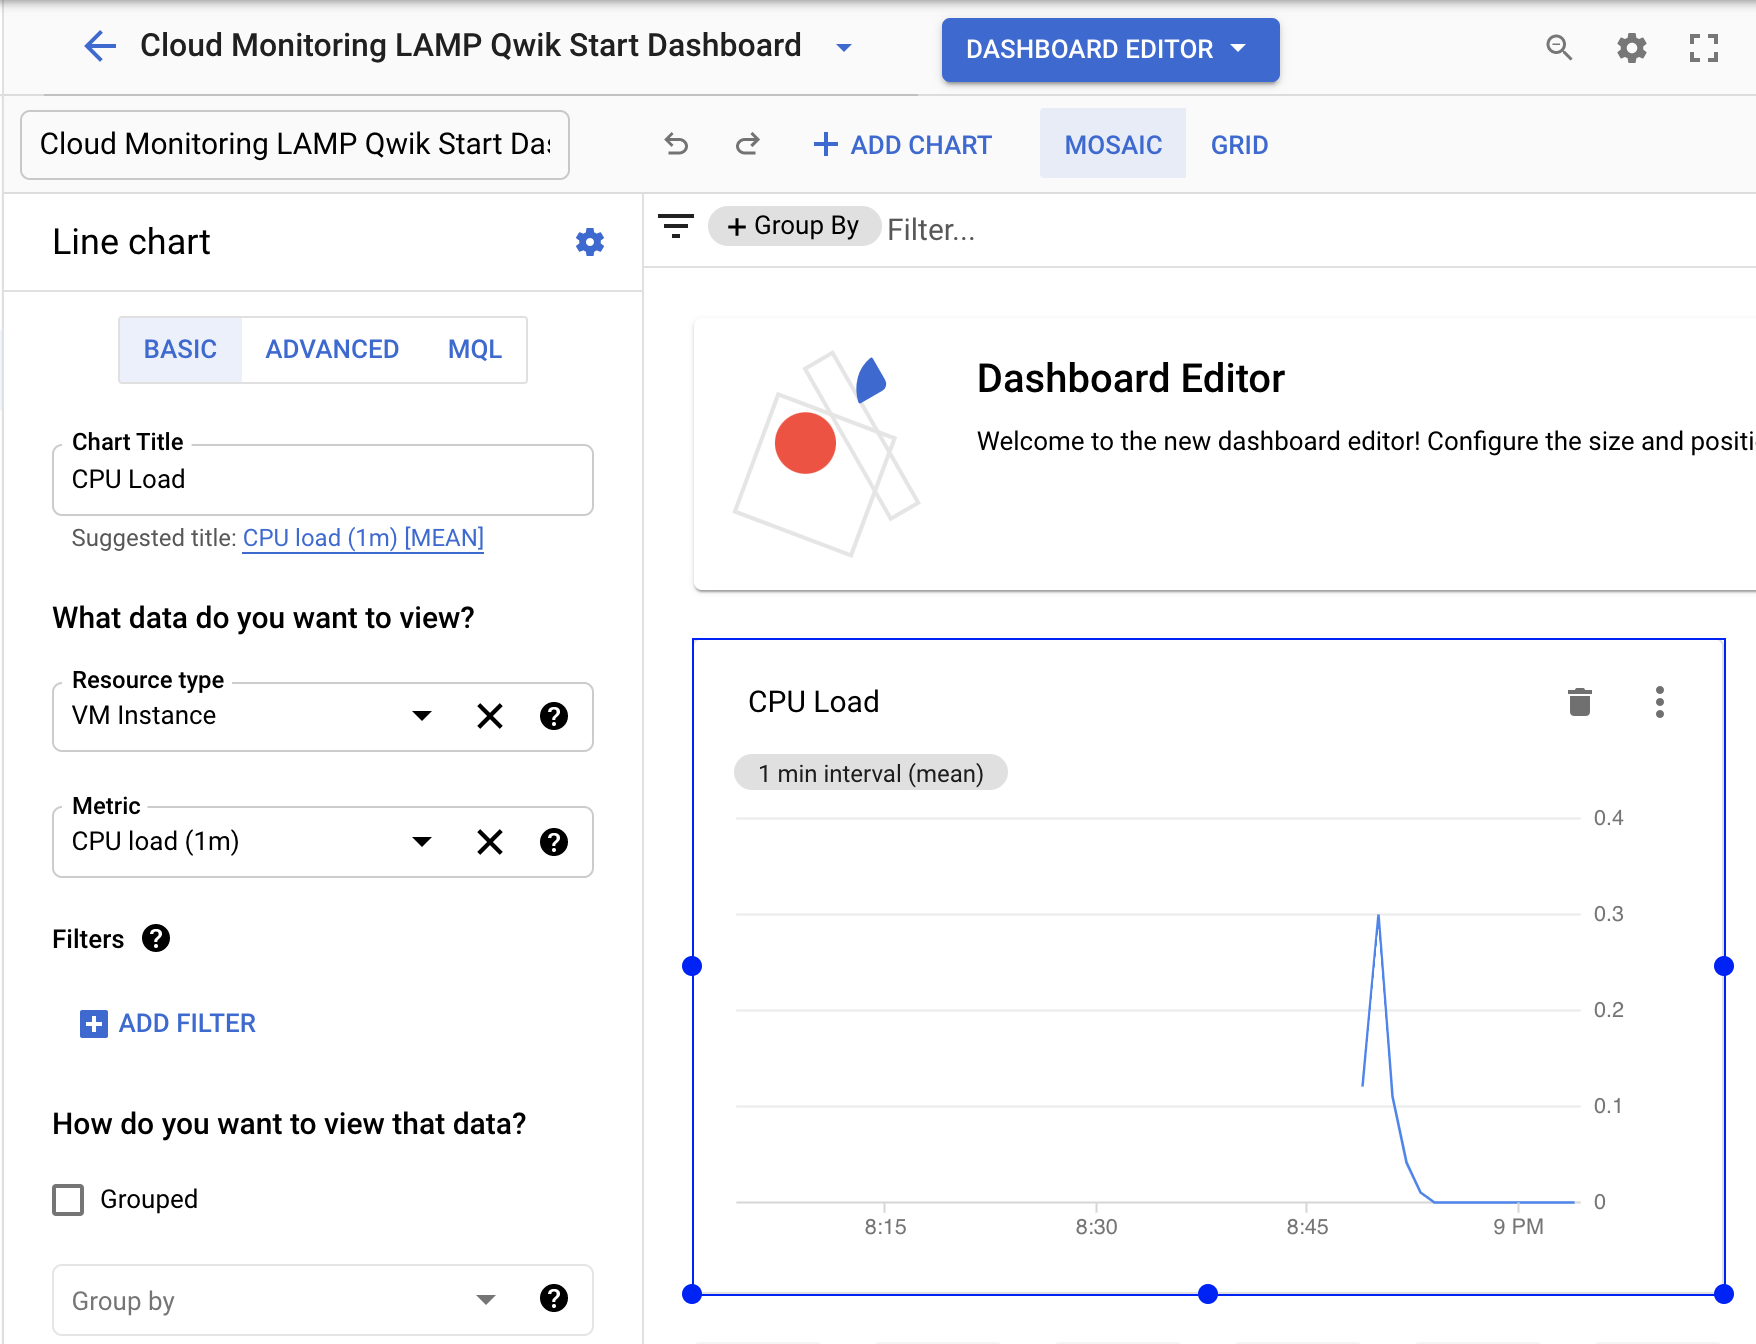
Add the first chart
Click Line option in Chart library.
Name the chart title CPU Load.
Set the Resource type to VM Instance.
Set the Metric CPU load (1m) (You may need to uncheck the only show active box). Refresh the tab to view the graph.
Add the second chart
Click + Add Chart and select Line option in Chart library.
Name this chart Received Packets.
Set the resource type to VM Instance.
Set the Metric Received packets (gce_instance). Refresh the tab to view the graph.
Leave the other fields at their default values. You see the chart data.
View your logs
Cloud Monitoring and Cloud Logging are closely integrated. Check out the logs for your lab.
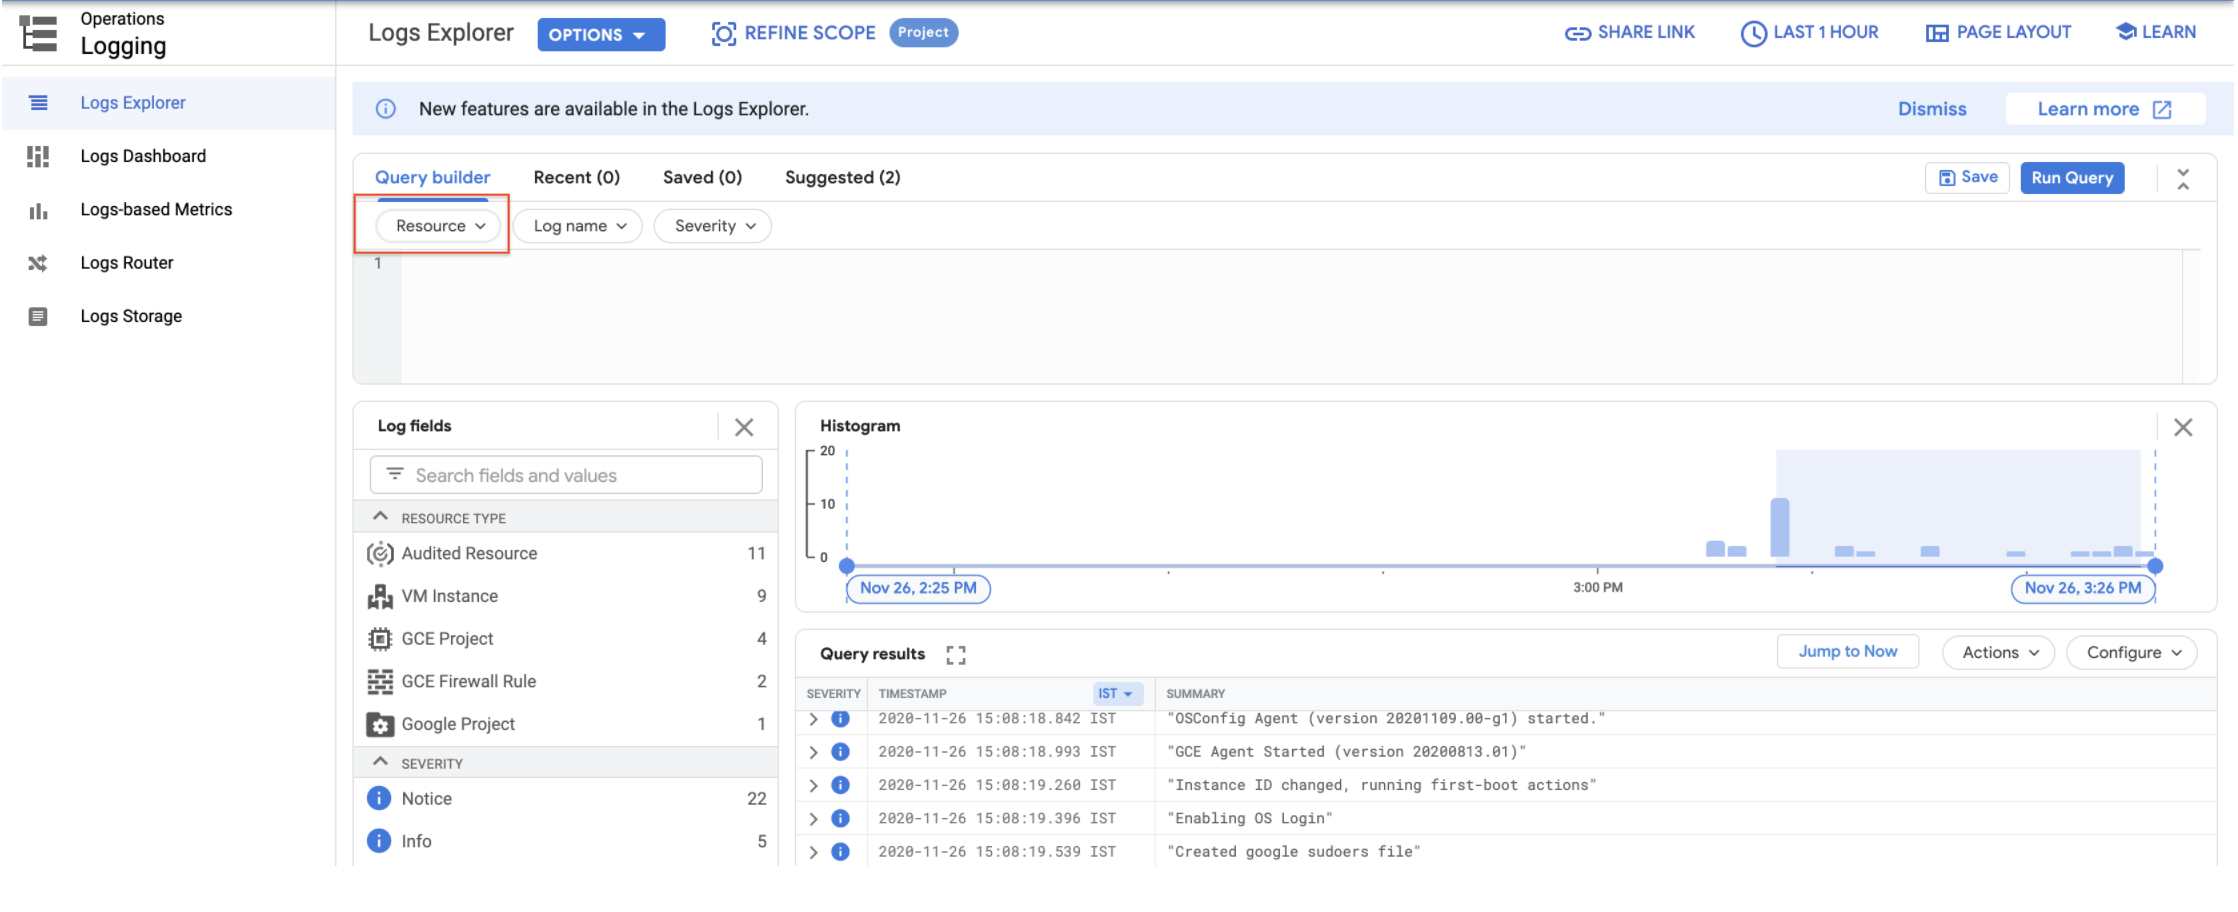
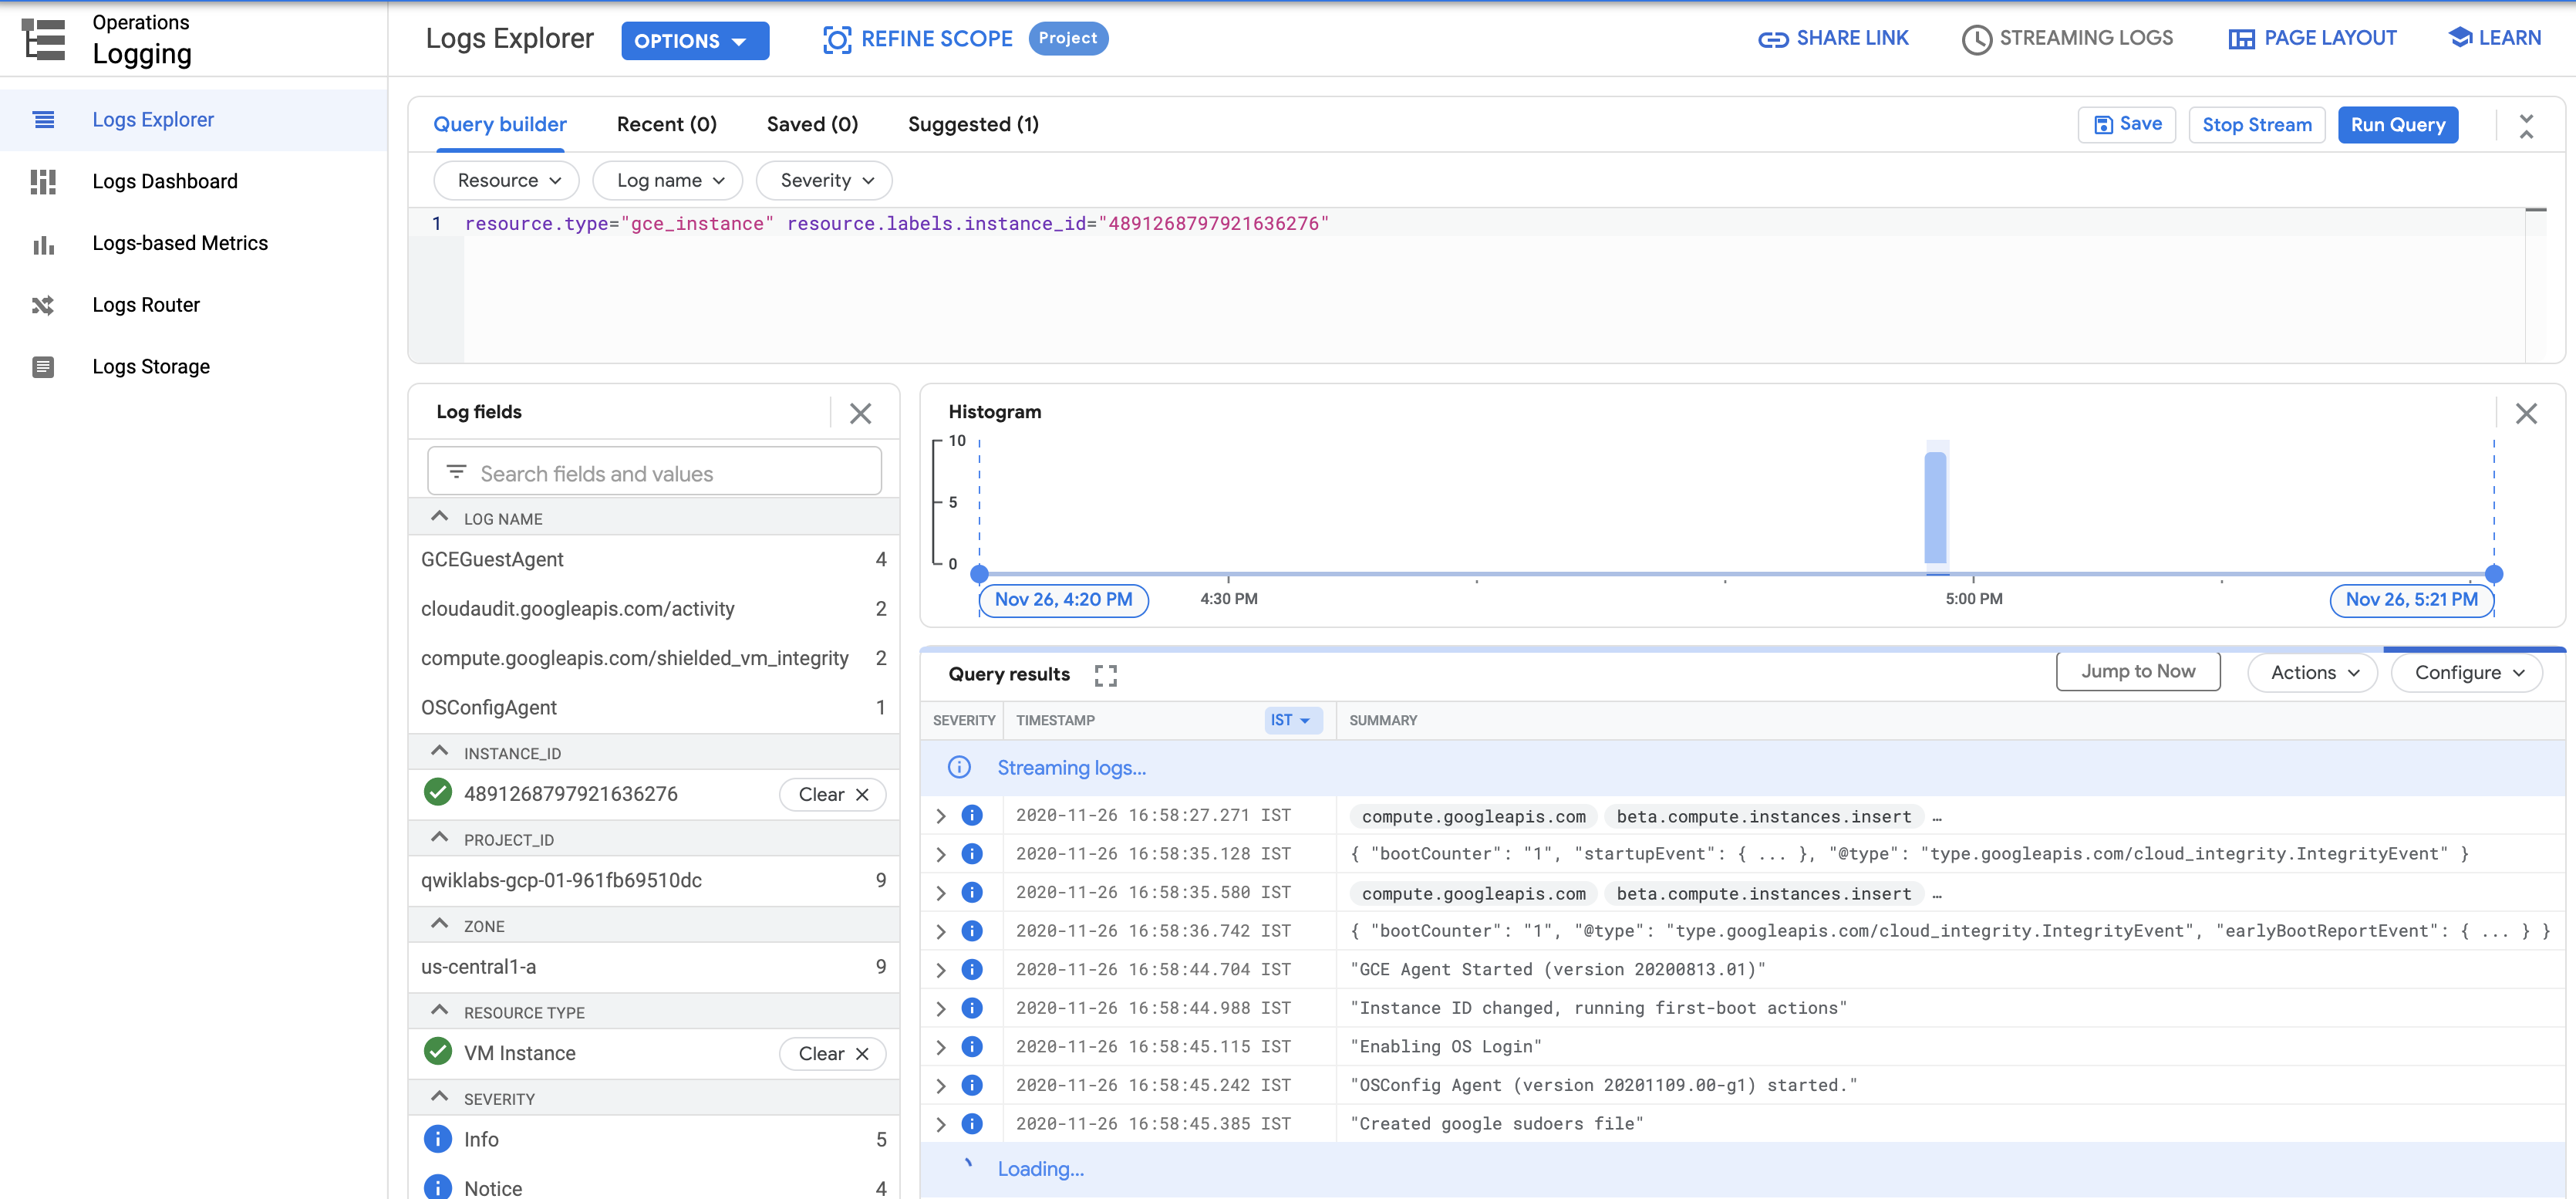
Select Navigation menu > Logging > Logs Explorer.
Select the logs you want to see, in this case, you select the logs for the lamp-1-vm instance you created at the start of this lab:
- Click on Resource.
- Select VM Instance > lamp-1-vm in the Resource drop-down menu.
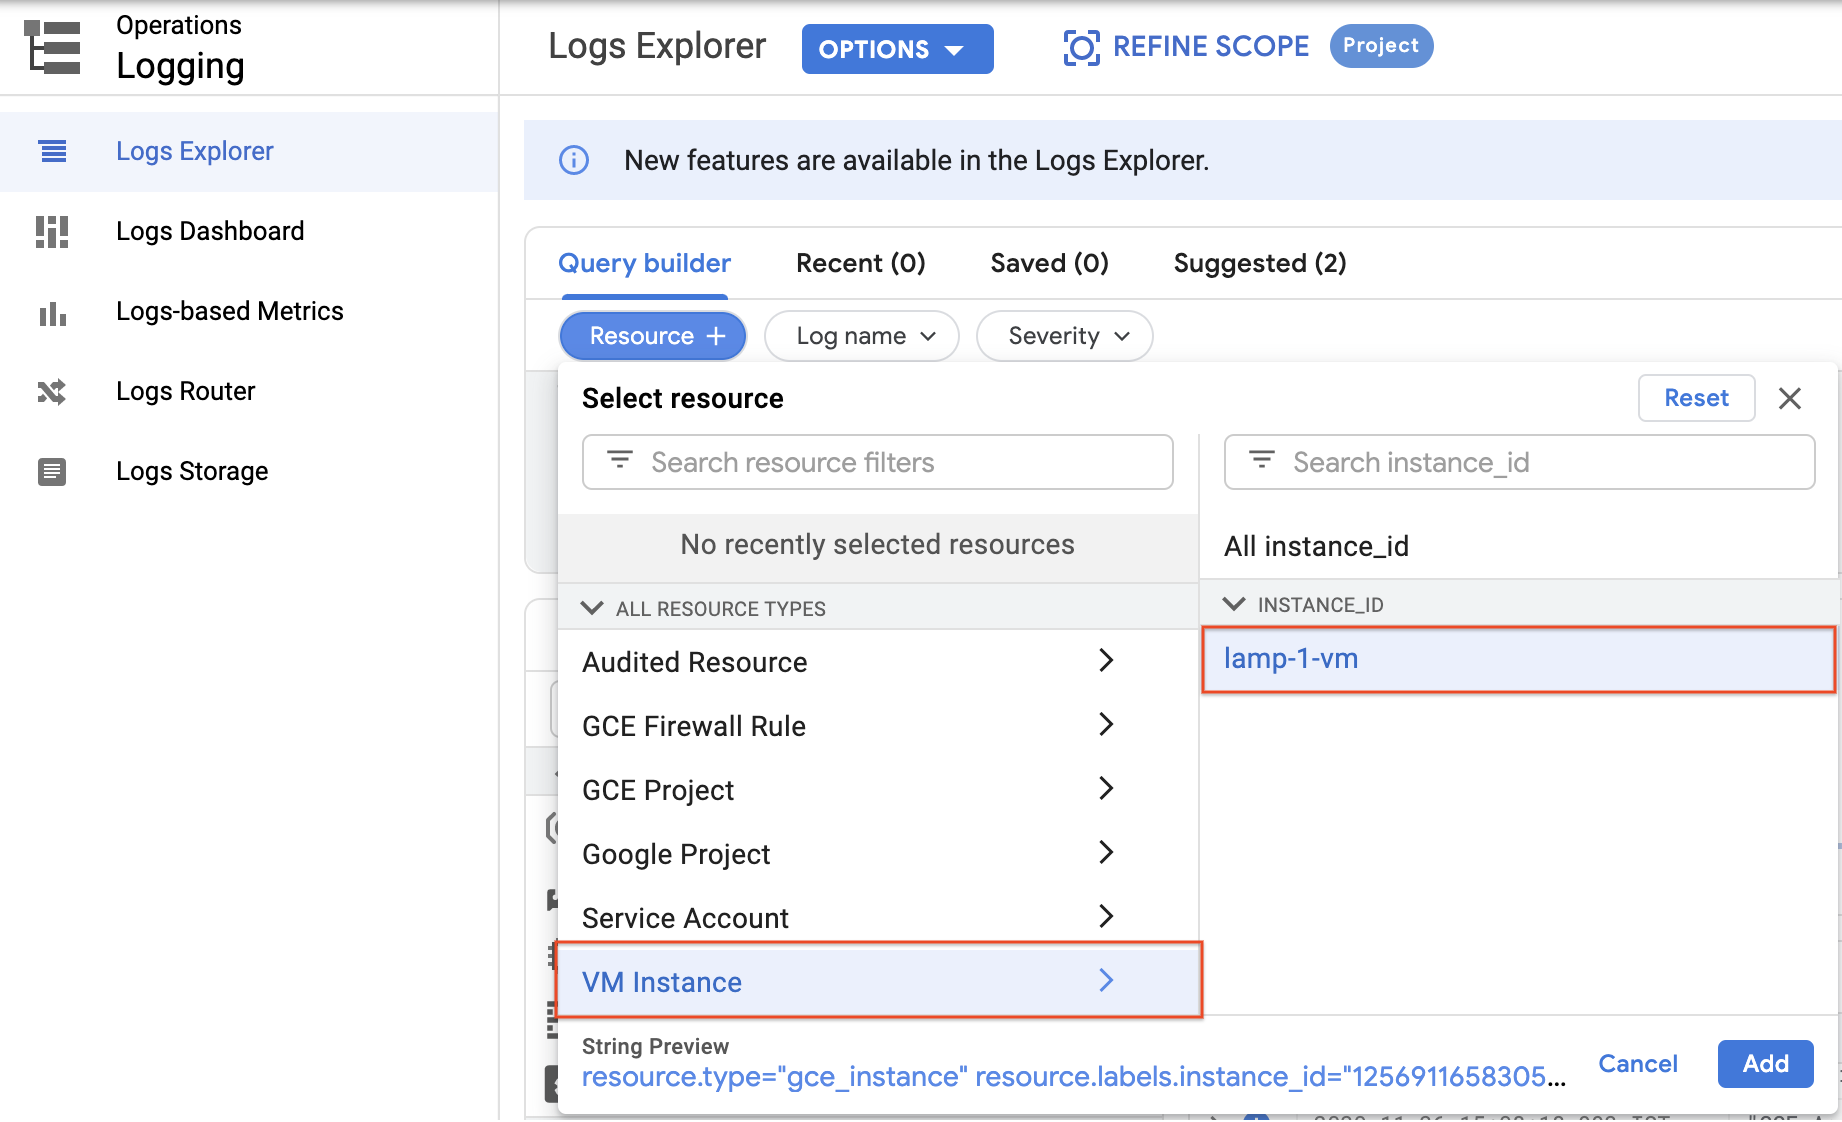
- Click Add.
- Leave the other fields with their default values.
- Click the Stream logs.
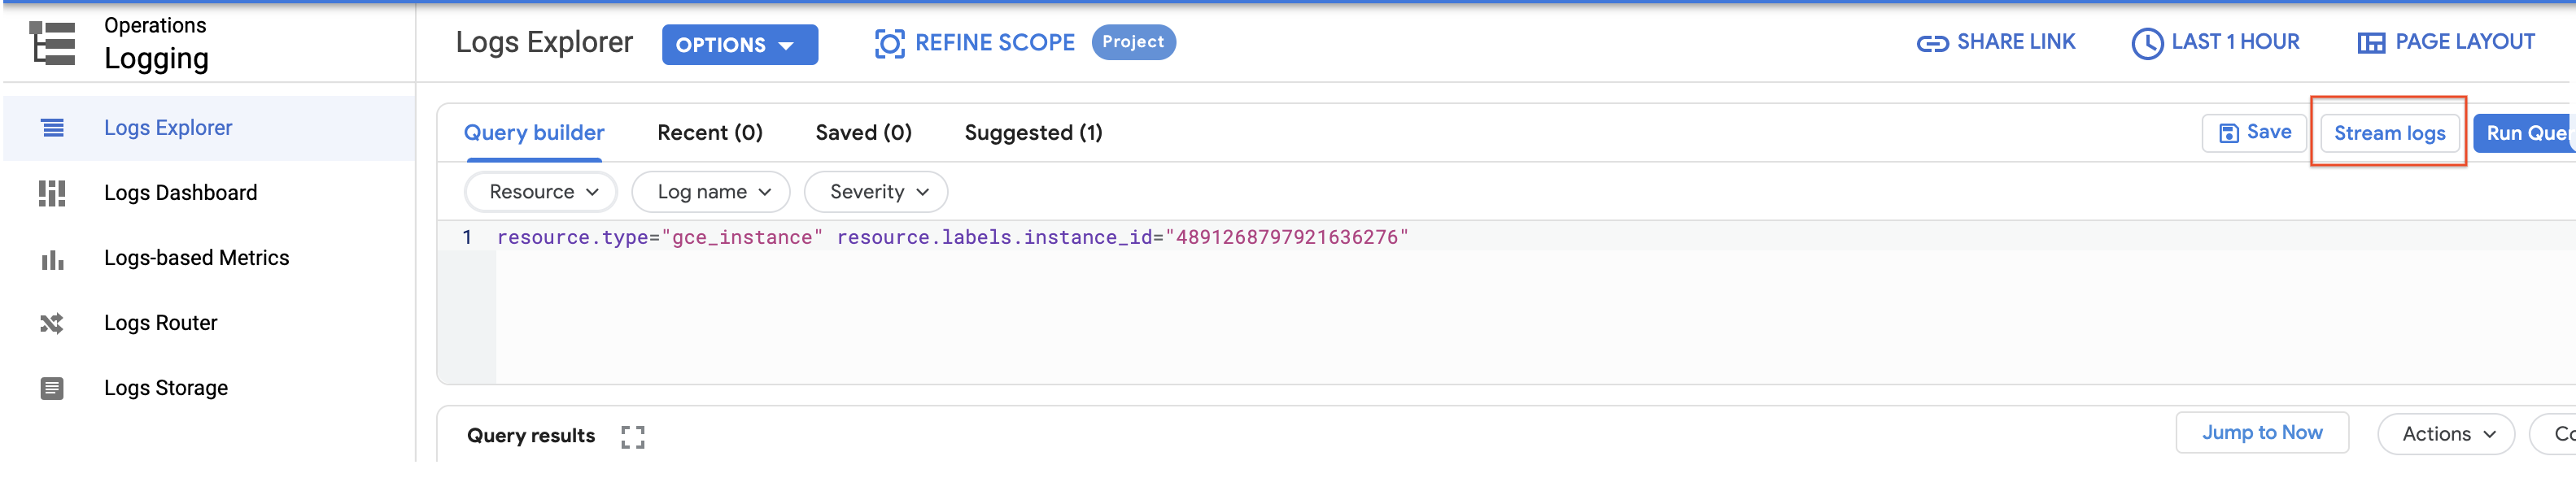
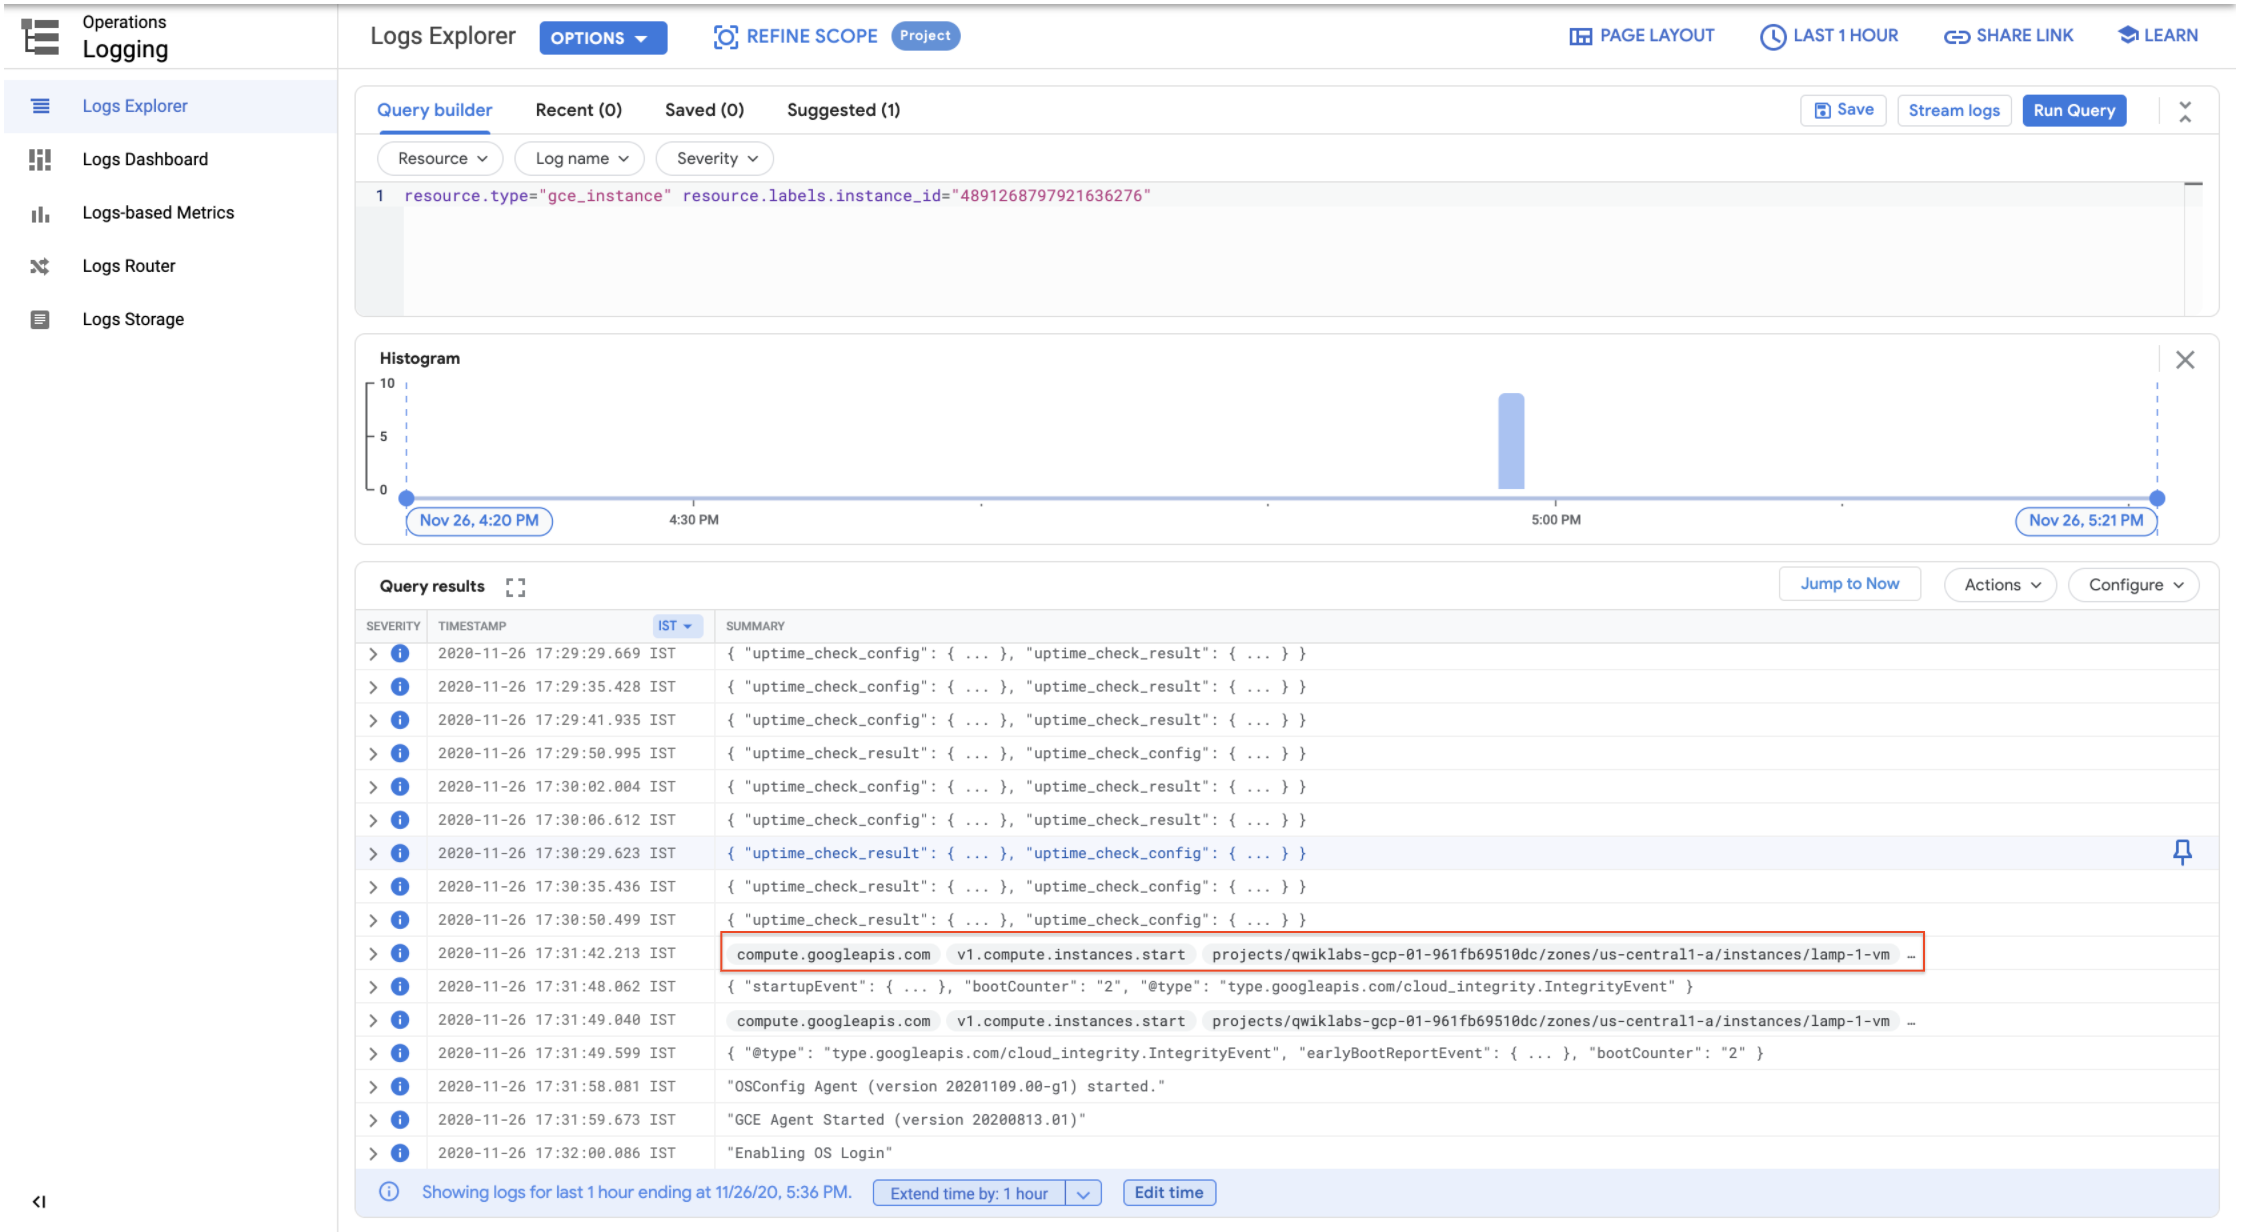
You see the logs for your VM instance:
Check out what happens when you start and stop the VM instance.
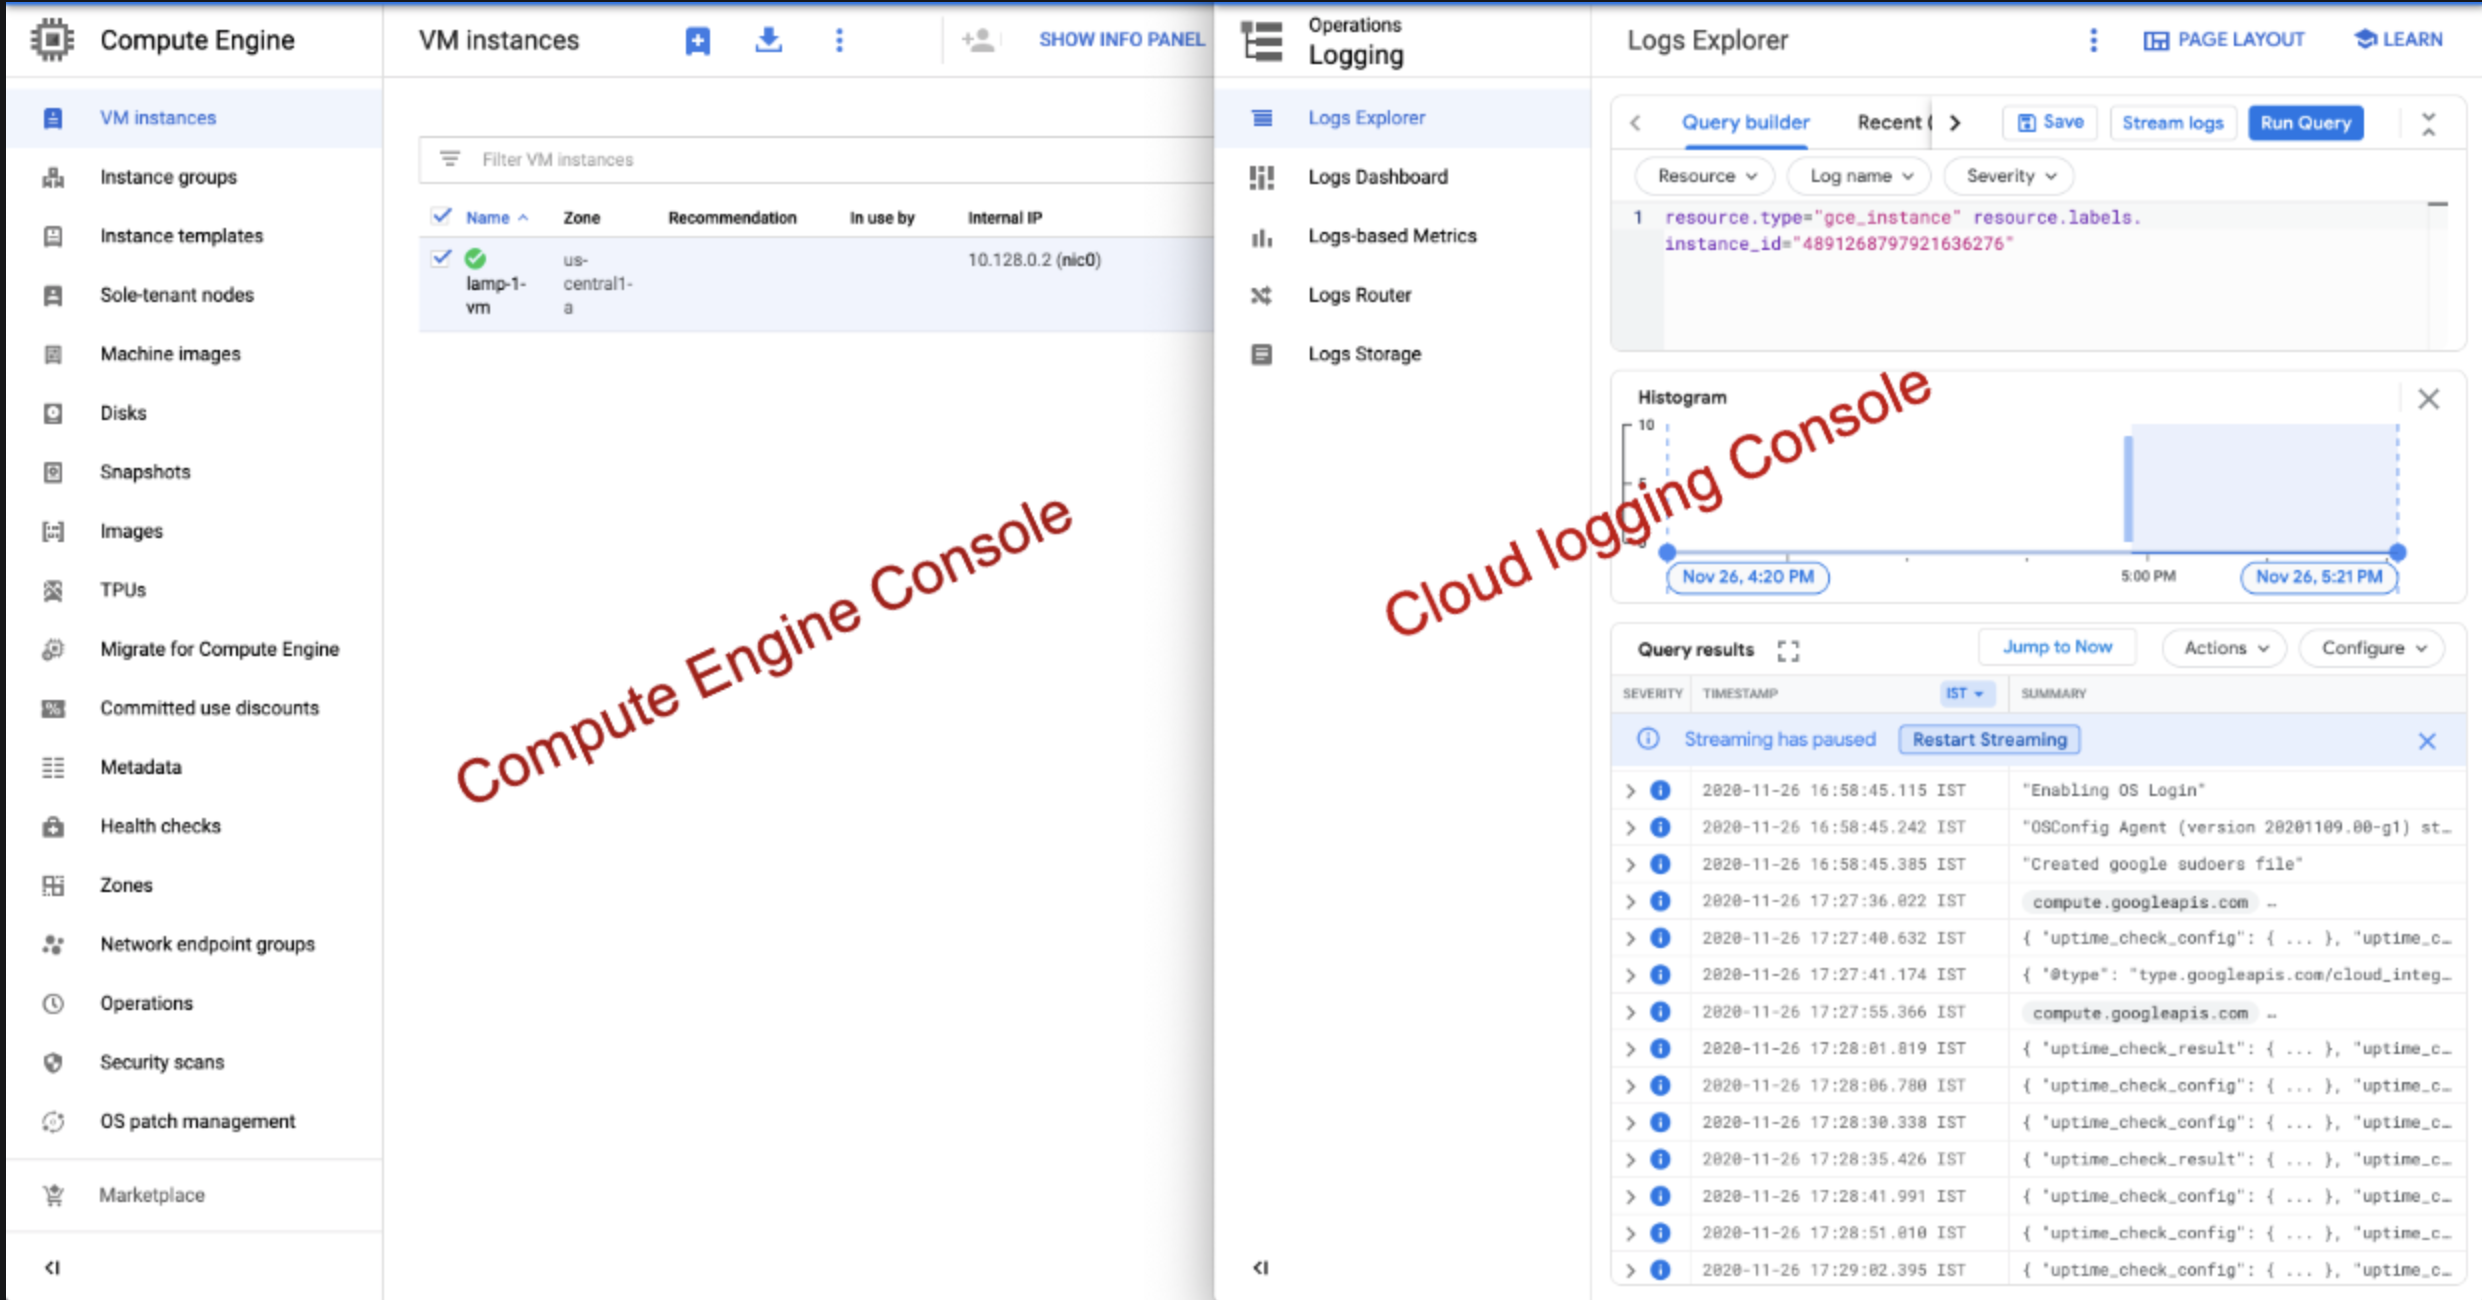
To best see how Cloud Monitoring and Cloud Logging reflect VM instance changes, make changes to your instance in one browser window and then see what happens in the Cloud Monitoring, and then Cloud Logging windows.
- Open the Compute Engine window in a new browser window. Select Navigation menu > Compute Engine, right-click VM instances > Open link in new window.
- Move the Logs Viewer browser window next to the Compute Engine window. This makes it easier to view how changes to the VM are reflected in the logs.
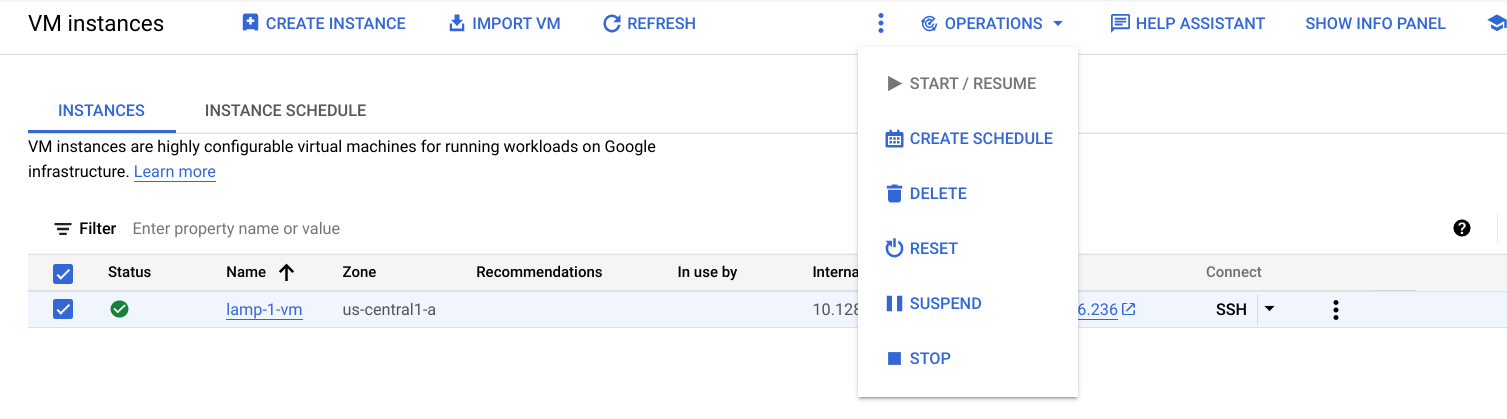
- In the Compute Engine window, select the lamp-1-vm instance, click the three vertical dots at the top of the screen and then click Stop, and then confirm to stop the instance.
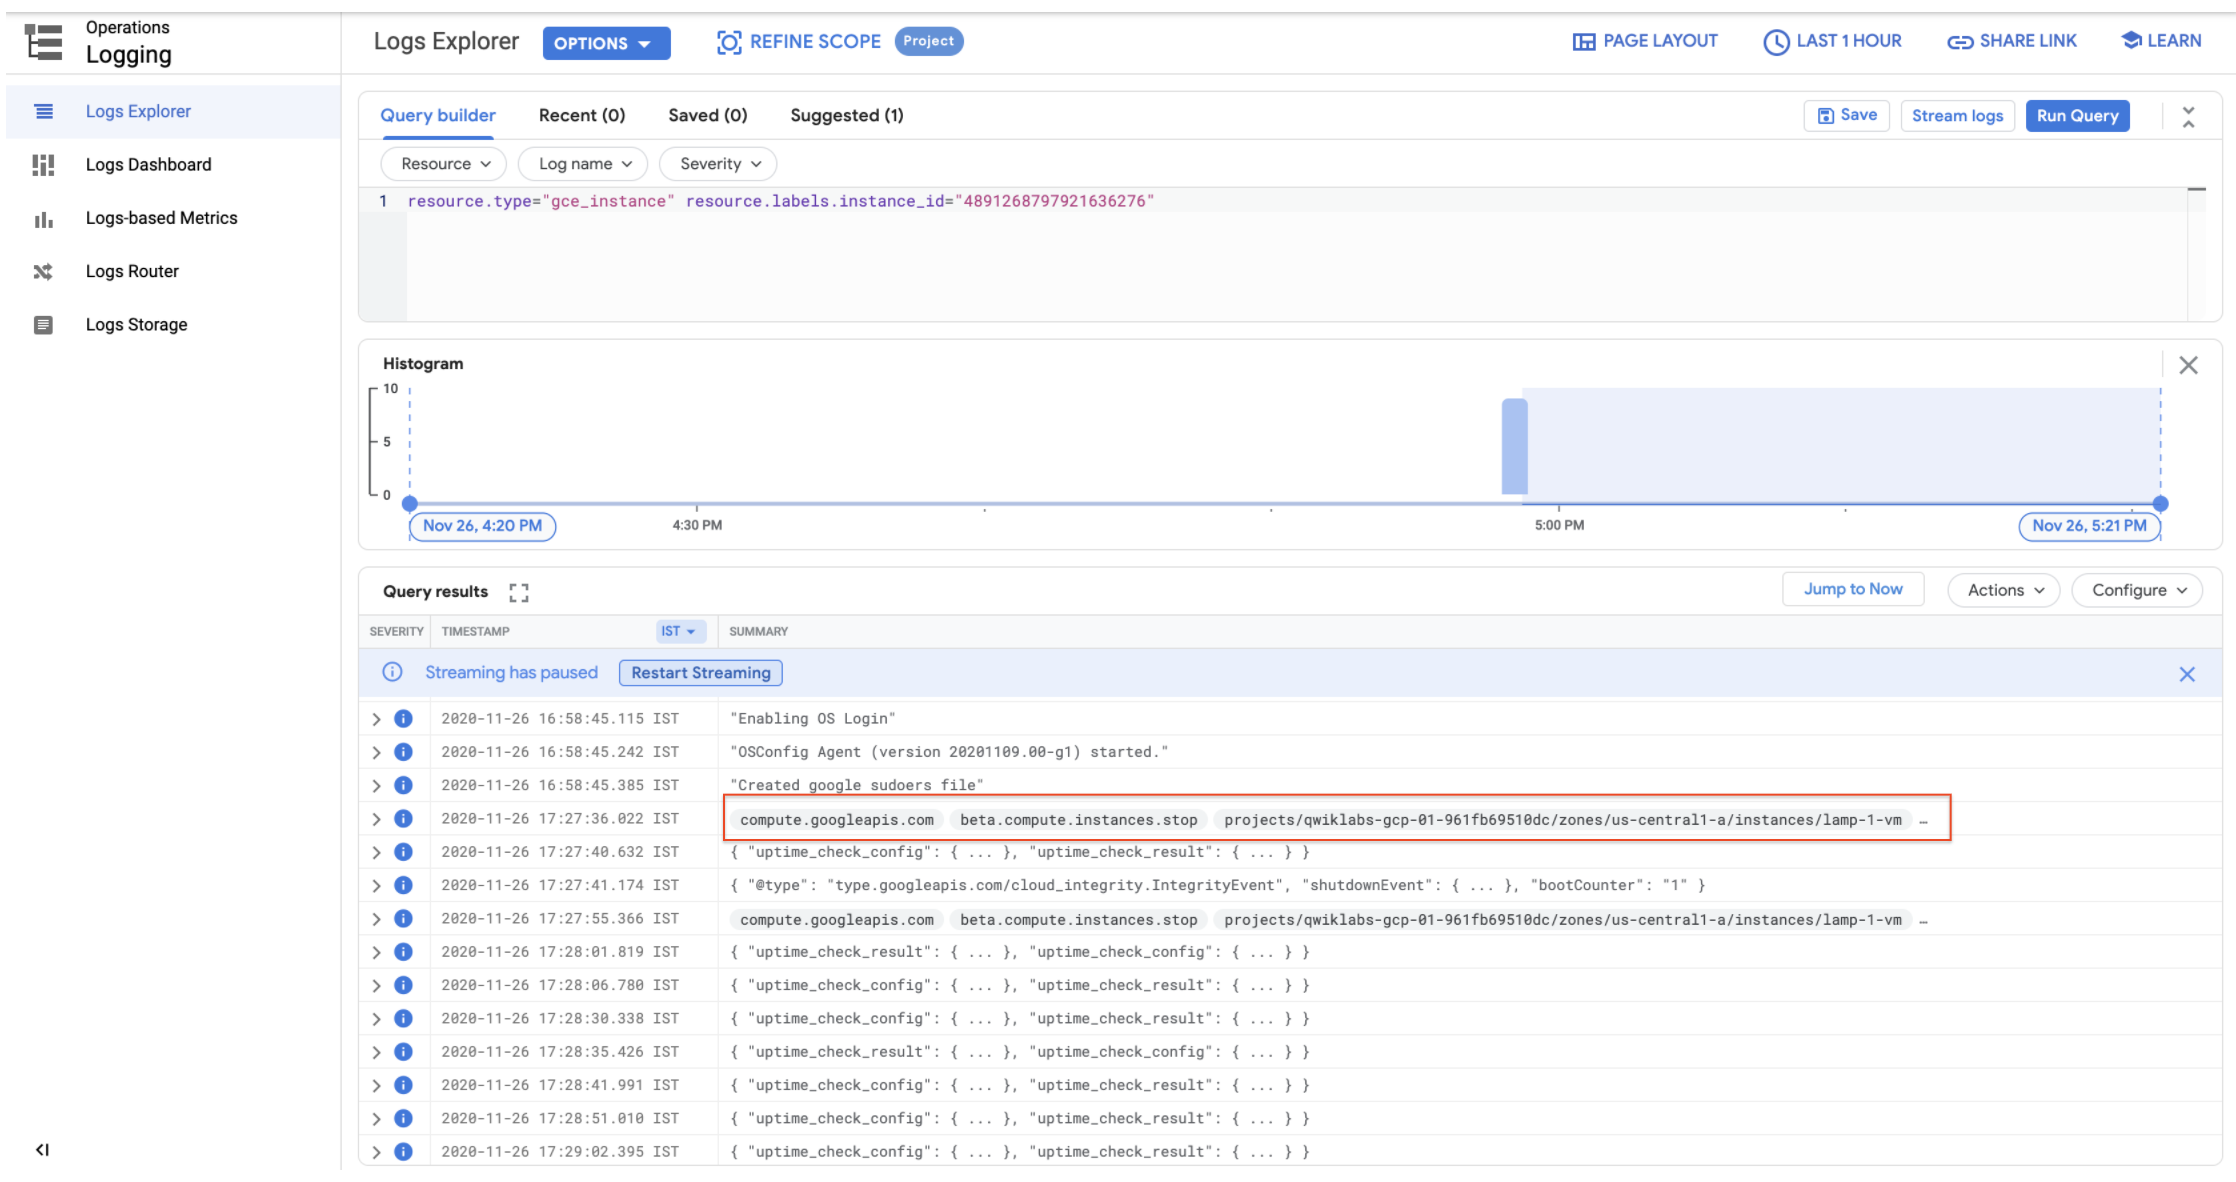
It takes a few minutes for the instance to stop.
- Watch in the Logs View tab for when the VM is stopped.
- In the VM instance details window, click the three vertical dots at the top of the screen and then click Start/resume, and then confirm. It will take a few minutes for the instance to re-start. Watch the log messages to monitor the start up.
Check the uptime check results and triggered alerts
- In the Cloud Logging window, select Navigation menu > Monitoring > Uptime checks. This view provides a list of all active uptime checks, and the status of each in different locations.
You will see Lamp Uptime Check listed. Since you have just restarted your instance, the regions are in a failed status. It may take up to 5 minutes for the regions to become active. Reload your browser window as necessary until the regions are active.
- Click the name of the uptime check,
Lamp Uptime Check.
Since you have just restarted your instance, it may take some minutes for the regions to become active. Reload your browser window as necessary.
Check if alerts have been triggered
In the left menu, click Alerting.
You see incidents and events listed in the Alerting window.
Check your email account. You should see Cloud Monitoring Alerts.
Note: Remove the email notification from your alerting policy. The resources for the lab may be active for a while after you finish, and this may result in a few more email notifications getting sent out.
Congratulations!
You have successfully set up and monitored a VM with Cloud Monitoring.


Finish your Quest
This self-paced lab is part of the Google Cloud's Operations Suite, Baseline: Infrastructure, Cloud Engineering, Cloud Development, and Optimizing Your Google Cloud Costs Quests. A Quest is a series of related labs that form a learning path. Completing this Quest earns you the badge above, to recognize your achievement. You can make your badge public and link to them in your online resume or social media account. Enroll in a Quest and get immediate completion credit if you've taken this lab. See other available Quests.
Take your next lab
This lab is also part of a series of labs called Qwik Starts. These labs are designed to give you a little taste of the many features available with Google Cloud. Search for "Qwik Starts" in the lab catalog to find the next lab you'd like to take!
No comments:
Post a Comment